


Full Spectrum Next Generation Sequencing, Bioinformatics and Biostatistics:
Premium, Certified Services at Competitive Prices
Services

Bioinformatics Service
 At Research and Testing, we know that generating sequence data is only half the battle. With sequencing technologies now producing millions of high quality reads per run, working with sequence data has become a significant obstacle for many researchers. At Research and Testing, we have a staff of dedicated bioinformaticians with extensive experience in overcoming these and a variety of other challenges that face researchers every day. We offer the following services:
• Denoising and chimera detection of next generation sequencing data.
• Classification of specific marker-based microbial diversity assays (e.g. 16S, 18S, ITS, SSU, etc…)
• Classification of shotgun library-based metagenomic diversity analysis to the strain level.
• Bacterial genome assembly and annotation.
• Custom sequence database creation and curation.
• Custom pipeline and software creation.
Interactive Krona
Amplicon Bioinformatics Pipeline
Demo Data
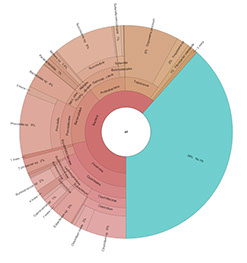 Interactive Krona:
Krona is an interactive display of taxonomic data from your samples. Each layer in the figure is a deeper taxonomic grouping (for example, species will be the outer most layer whereas kingdom will be near the center). Krona files open in a browser so you will need access to your browser. To get started with the demo krona to the right, simply click on the image.
Once you have pulled up the page you will notice on the top left there is a list of samples. Below that are some formatting options.
Max Depth allows you to determine which taxonomic level is the outermost later by selecting how many total layers are shown on the graph.
The collapse button below chart size will allow you to reduce or expand monotypic taxa to first level that shows more than one member.
Within the graph itself, double clicking on a taxon in an interior level will cause that taxon to become the center of the graph, and all of its daughter taxa to circle around it. When you do this, mini-graphs will appear in the top right representing the levels that have been minimized. You can return the graph to the original size simply by clicking on the “All” graph.
Play around a little. For more information, click here.
 Amplicon Bioinformatics Pipeline:
For an in-depth description of our pipeline methodology, click here.
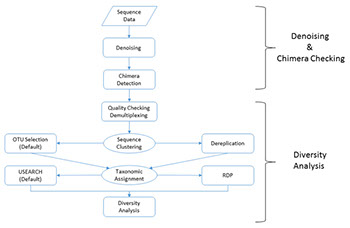
Our microbial diversity services include taxonomic analysis using our custom data analysis pipeline. The data analysis pipeline consists of two major stages, the denoising and chimera detection stage and the microbial diversity analysis stage. A brief overview and visualization of our current pipeline can be found below:
• Denoising and Chimera Checking
1. Quality Trimming
2. Denoising
3. Chimera Checking
• Microbial Diversity Analysis
1. Quality Checking
2. FASTA Formatted Sequence/Quality File Generation
3. Sequence Clustering
4. Taxonomic Identification
5. Data Analysis
 Demo Data:
For examples of data that you would receive, download the following .zip files:
- Demo Data B (93MB)
- Demo Data E (92MB)
Helpful Resources
[1] S. M. Huse, J. A. Huber, H. G. Morrison, M. L44. Sogin and D. M. Welch, "Accuracy and quality of massively parallel DNA pyrosequencing.," Genome Biology, vol. 8, no. 7, 2007.
[2] C. Quince, A. Lanzen, R. J. Davenport and P. J. Turnbaugh, "Removing Noise From Pyrosequenced Amplicons," BMC Bioinformatics , vol. 12, no. 38, 2011.
[3] M. A. Quail, M. Smith, P. Coupland, T. D. Otto, S. R. Harris, T. R. Connor, A. Bertoni, H. P. Swerdlow and Y. Gu, "A tale of three next generation sequencing platforms: comparison of Ion Torrent, Pacific Biosciences and Illumina MiSeq sequencers," BMC Genomics, 2012.
[4] J. Zhang, K. Kobert, T. Flouri and A. Stamatakis, "PEAR: A fast and accurate Illumina Paired-End reAd Page 16 of 16 mergeR, "Bioinformatics, 2013.
[5] R. C. Edgar, "Search and clustering orders of magnitude faster than BLAST," Bioinformatics, pp. 1-3, 12 August 2010.
[6] R. C. Edgar, "UPARSE: highly accurate OTU sequences from microbial amplicon reads," Nature Methods, vol. 10, pp. 996-998, 2013.
[7] R. C. Edgar, B. J. Haas, J. C. Clemente, C. Quince and R. Knight, "UCHIME improves sensitivity and speed of chimera detection," Oxford Journal of Bioinformatics, vol. 27, no. 16, pp. 2194-2200, 2011.
[8] B. J. Haas, D. Gevers, A. M. Earl, M. Feldgarden, D. V. Ward, G. Giannoukos, D. Ciulla, D. Tabbaa, S. K. Highlander, E. Sodergren, B. Methé, T. Z. DeSantis, The Human Microbiome Consortium, J. F. Petrosino, R. Knight and B. W. Birren, "Chimeric 16S rRNA sequence formation and detection in Sanger and 454-pyrosequenced PCR amplicons," Genome Research, 2011.
[9] P. Schloss, S. L. Westcott, T. Ryabin, J. R. Hall, M. Hartmann, E. B. Hollister, R. A. Lesniewski, B. B. Oakley, D. H. Parks, C. J. Robinson, J. W. Sahl, B. Stres, G. G. Thallinger, D. J. V. Horn and C. F. Weber, "Introducing mothur: Open-source, platform-independent, community-supported software for describing and comparing microbial communities," Appl Environ Microbiol, vol. 75, no. 23, pp. 7537-41, 2009.
[10] P. J. A. Cock, T. Antao, J. T. Chang, B. A. Chapman, C. J. Cox, A. Dalke, I. Friedberg, T. Hamelryck, F. Kauff, B. Wilczynski and M. J. L. d. Hoon, "Biopython: freely available Python tools for computational molecular biology and bioinformatics," Bioinformatics, vol. 25, no. 11, 2009.
[11] N. A. Bokulich, J. R. Rideout, K. Patnode, Z. Ellett, D. McDonald, B. Wolfe, C. F. Maurice, R. J. Dutton, P. J. Turnbaugh, R. Knight and J. G. Caporaso, "An extensible framework for optimizing classification enhances short-amplicon taxonomic assignments," Not Yet Published, 2014.
[12] Q. Wang, G. M. Garrity, J. M. Tiedje and J. R. Cole, "Naive Bayesian classifier for rapid assignment of rRNA sequences into the new bacterial taxonomy.," Applied and Environmental Microbiology, vol. 73, no. 16, pp. 5261-5267, 2007.